

Visualise the status or progress of items
Use the Boards app to apply Kanban methodology to your Alloy operations!
Each board displays items of a particular design or interface and groups them by a target attribute. Each column represents a possible value of that attribute. Items appear under the relevant column, according to the value they hold for the target attribute. Items can be dragged between columns to change their attribute value accordingly, without leaving the board.
This provides a simple yet effective visualisation of the state or progress of those items.
Boards can easily be shared with other users in your Alloy customer project, making it possible to distribute standardised boards to staff within specific roles or teams.
Use cases
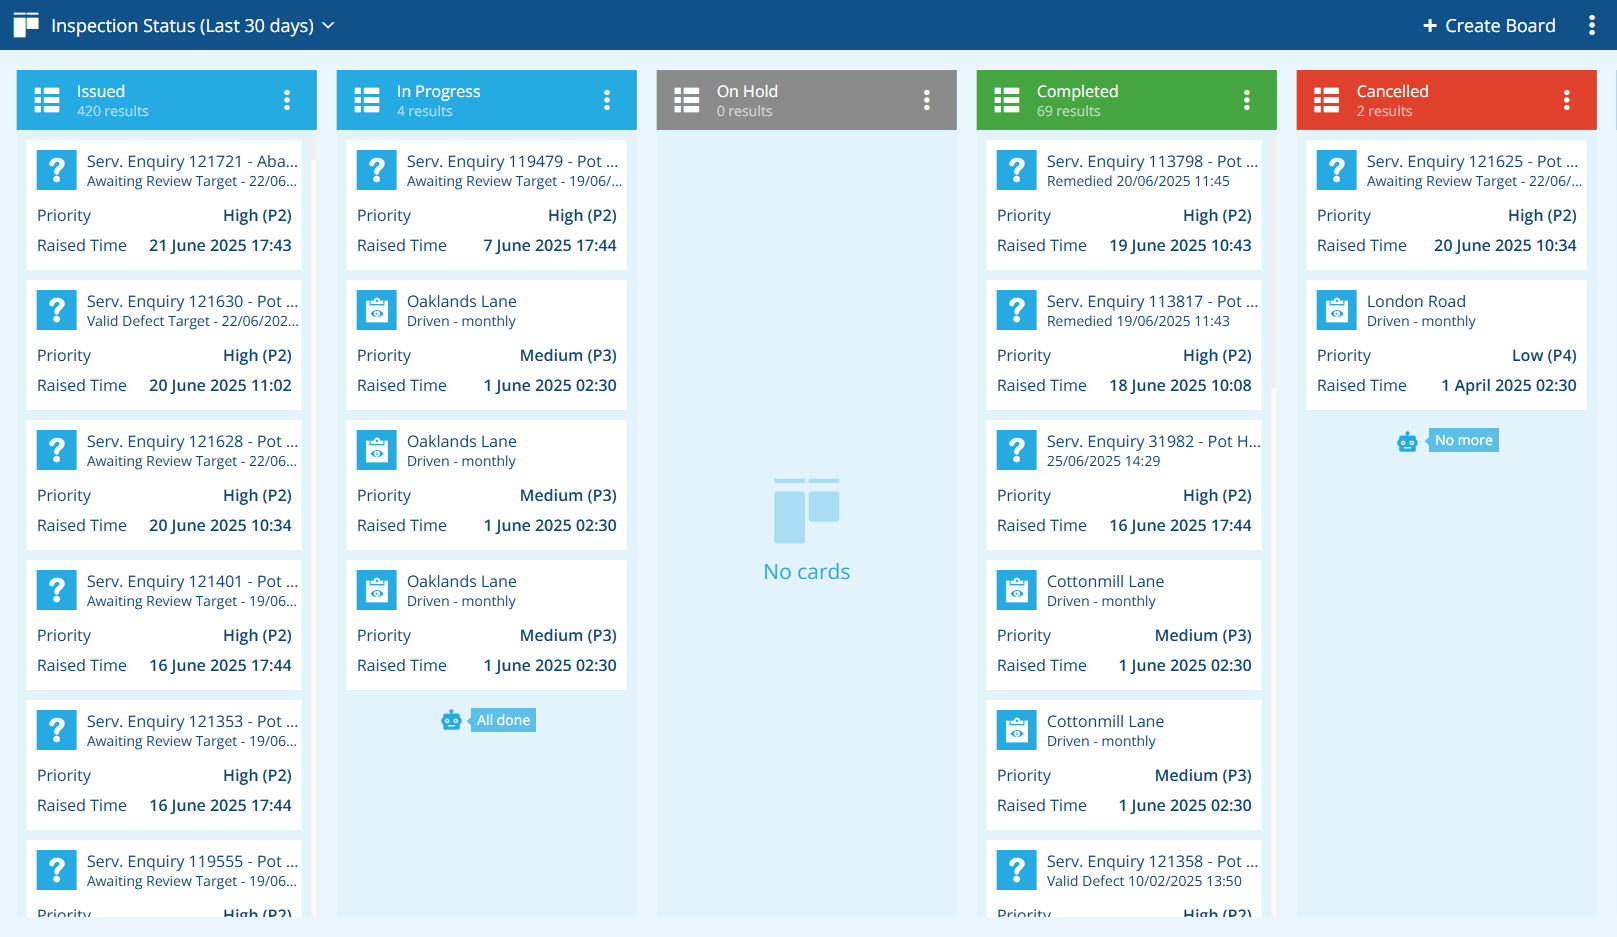
A typical use case is task management. For a given task type, you could create a board that tracks the Status or Priority attribute of those task items, sorted by their Raised Time. This provides a visualisation of the current task distribution and makes it easy to update tasks by dragging them between columns.
Similarly, you could create a task allocation board that tracks the Team attribute of task items. By including a column for each team value, and an Unconnected column for tasks where the attribute is empty, you can then drag tasks between the columns to allocate them to teams. To prevent closed tasks from appearing, you can filter the board's query, so that only tasks with a Status of Proposed, Issued or In Progress are shown.
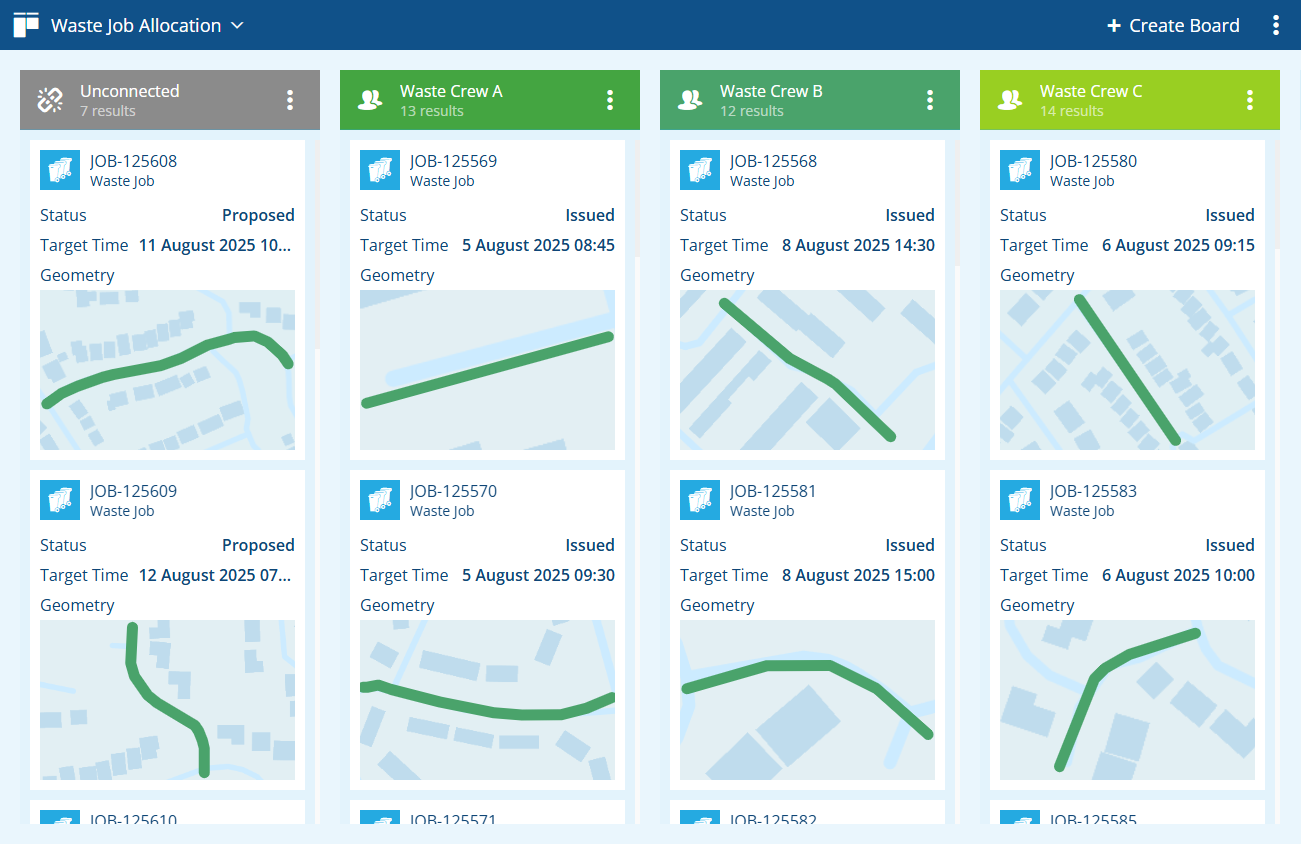
For extra convenience, create an event workflow to automatically update a job's Status attribute to Issued when its Team attribute changes 😎.
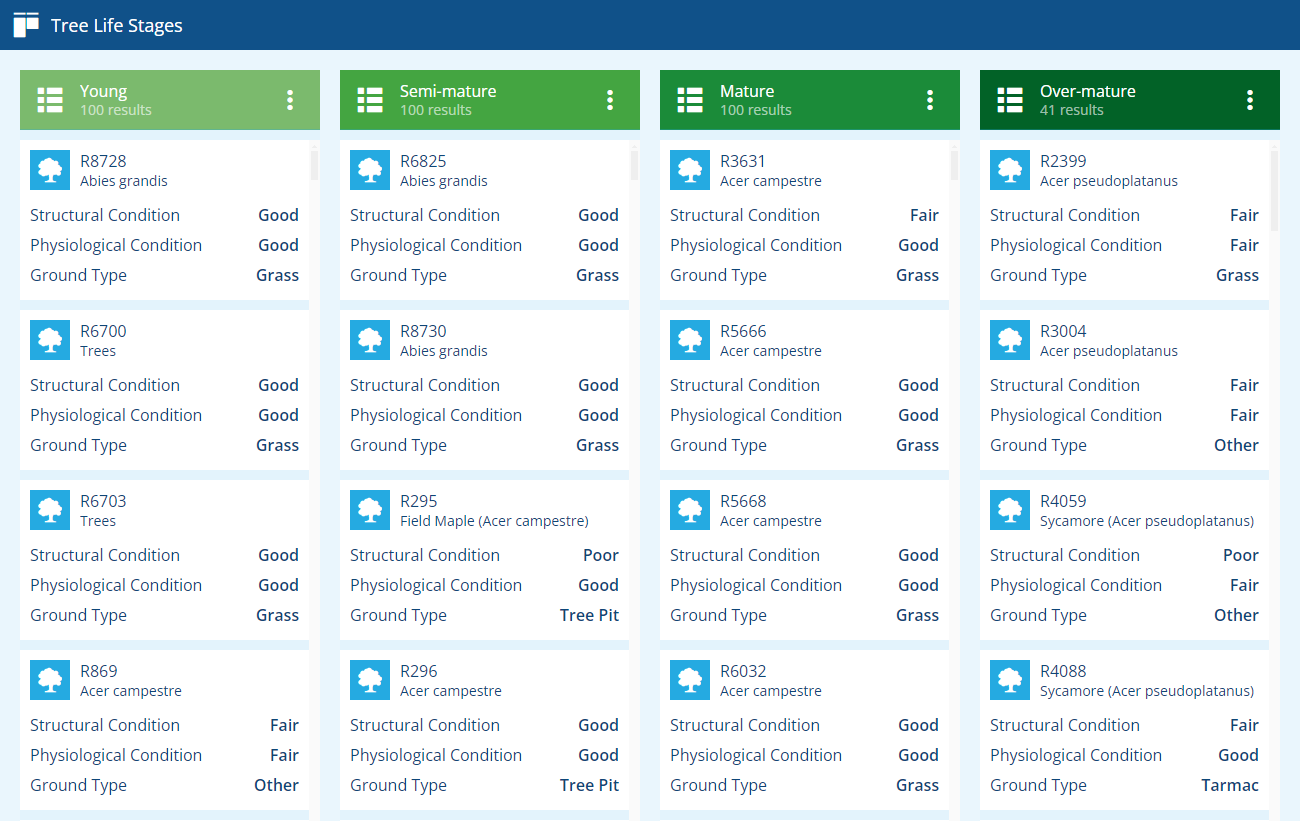
But it doesn't stop there! Alloy provides you with the flexibility to adopt this methodology for any type of thing. It can be used to track asset conditions, team assignments, vehicle locations, and any other type of categorisation that you can imagine.
For example, the board below tracks the Life Stage attribute of a Trees design.
Add to hubs
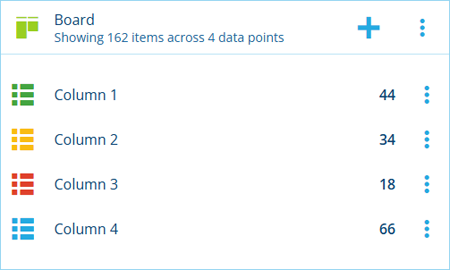
Include boards within hubs by adding them as widgets. This lets you view each column's item count and visualise those numbers alongside other data points in bar/donut graphs. It also provides a handy shortcut for opening a column's items within a compatible Alloy app, such as the Data Explorer.
Access from Home
To access the Boards app, visit Alloy Home in your web browser. Select the app to launch it in the current browser tab. Alternatively, select the app's button and choose Open in new window (or use middle-click or Ctrl-click).
If you belong to multiple customer projects, use the top app bar to select the one you want to work with.
To set Boards as the default app that launches after signing in, see User settings.