View the hub
Access multiple data streams in one place
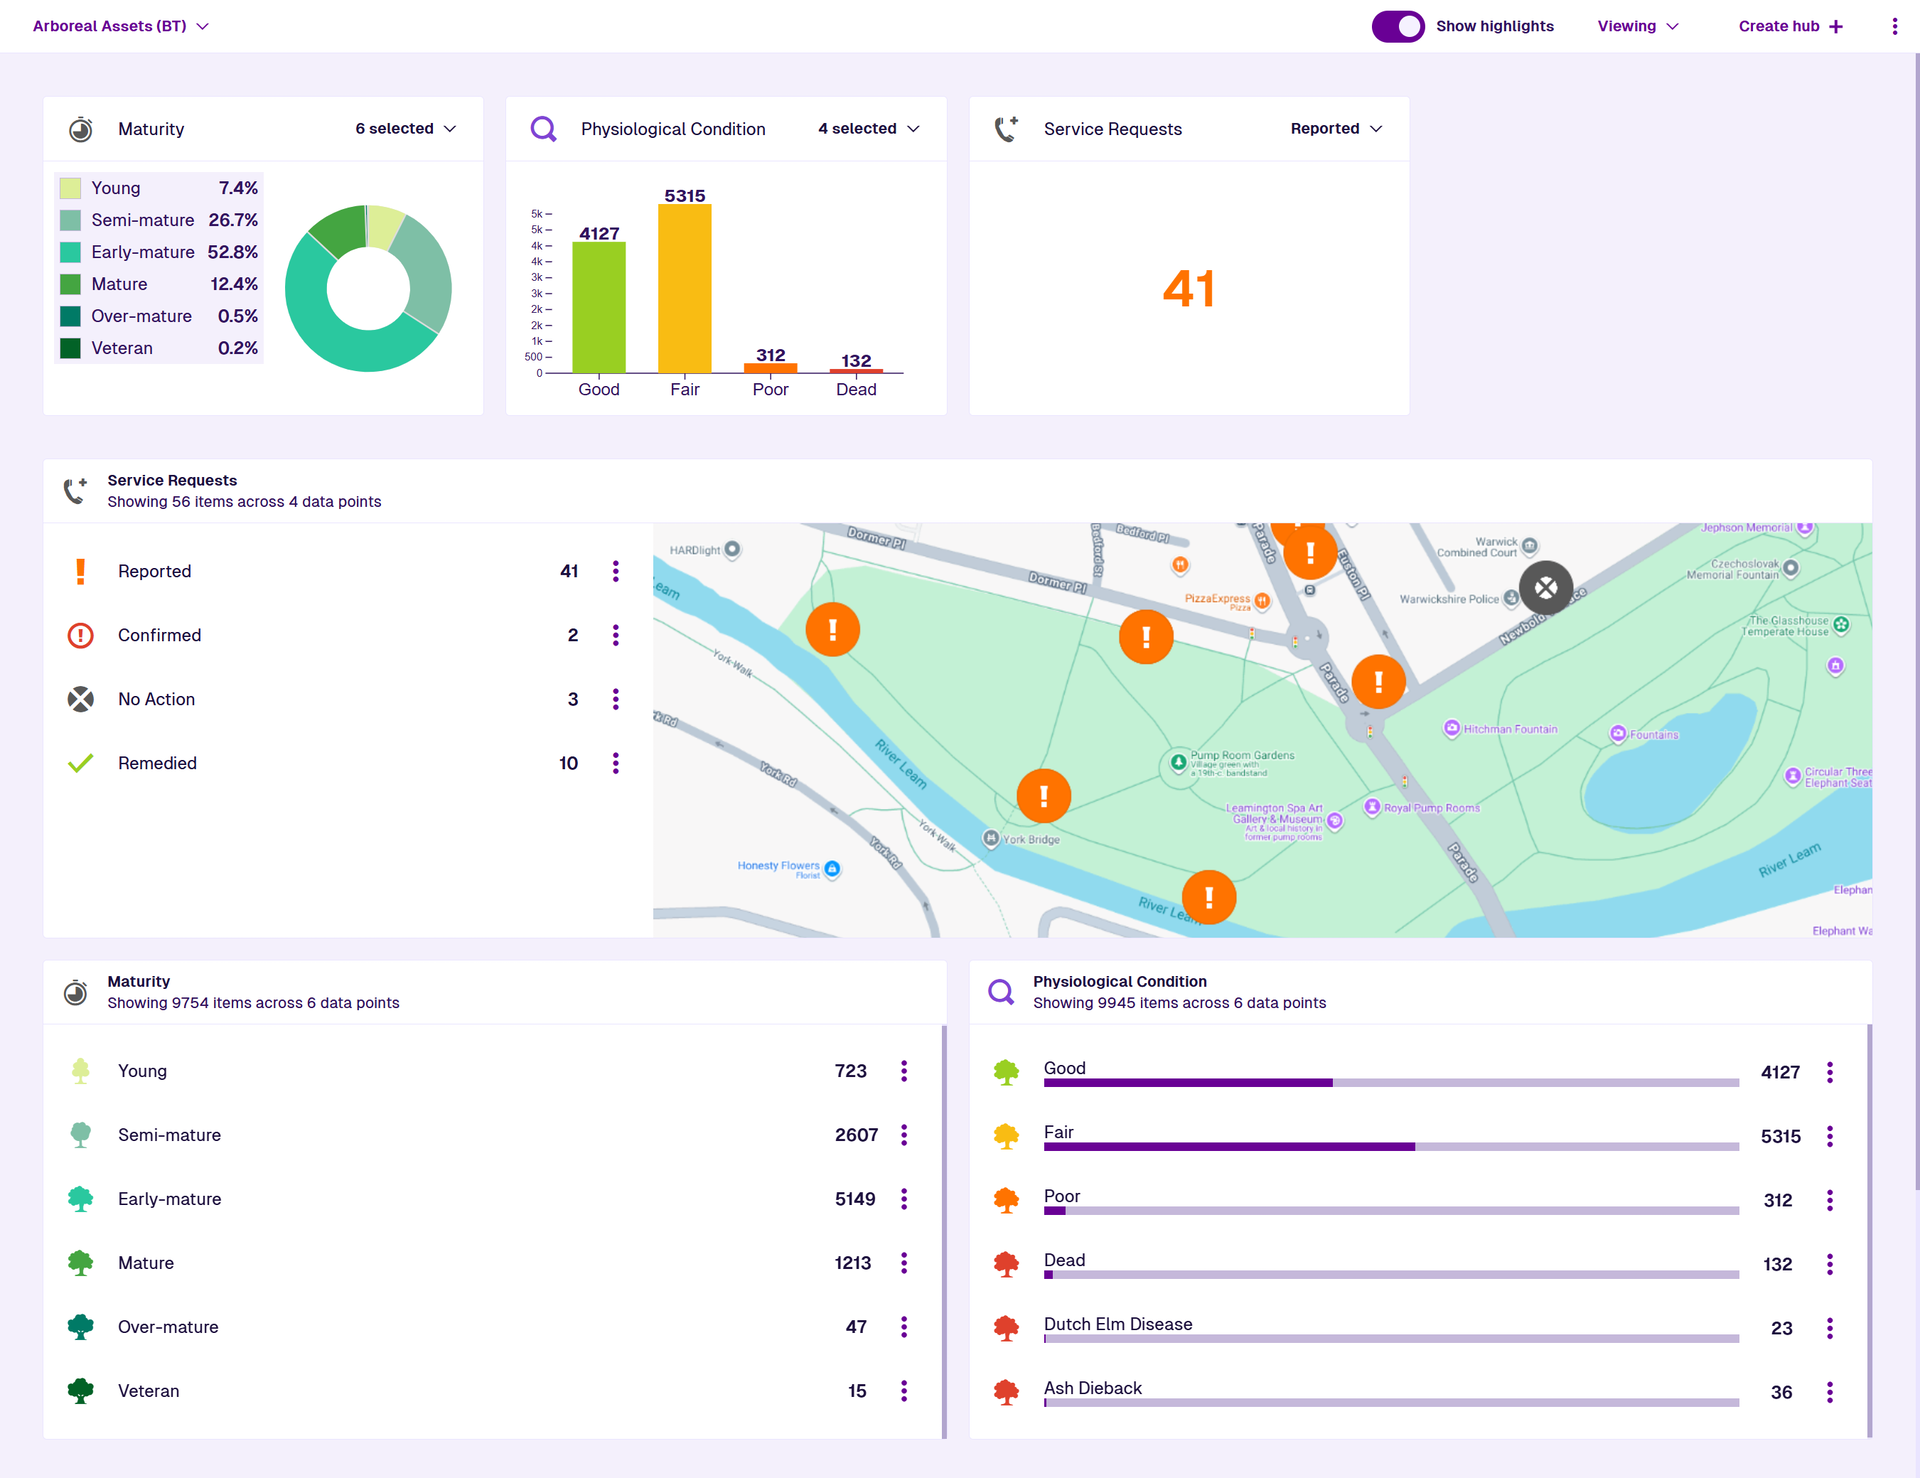
When you load a hub, it always starts in Viewing mode. This lets you see and interact with the data points displayed by each widget in the hub. They are typically collated from various sources throughout your company project.
To configure the hub's widgets and highlights, see Edit the hub.
If a data point query fails, it will display a button. Select it for more details.
Widgets
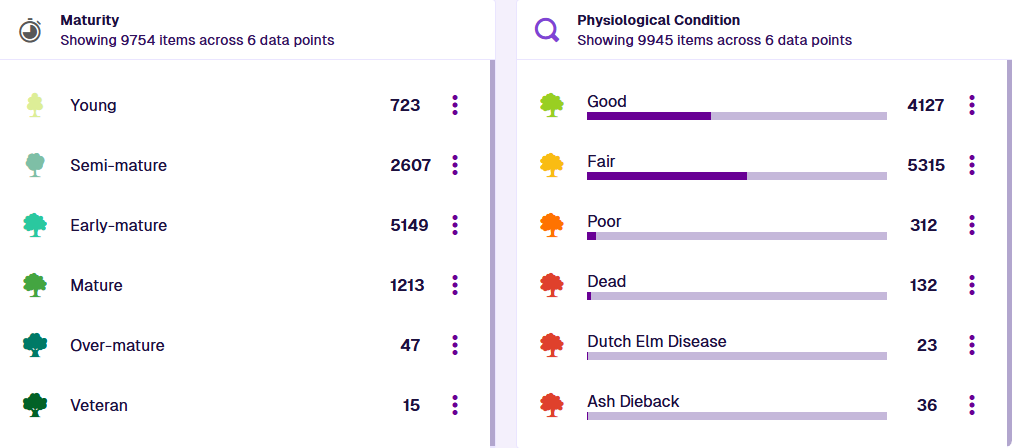
Each widget displays a set of data point queries. The current item count of each data point is shown and the total item count appears in the widget's header. If the widget contains many data points, scroll down to see more.
You won't see data points for things that you don't have permission to view.
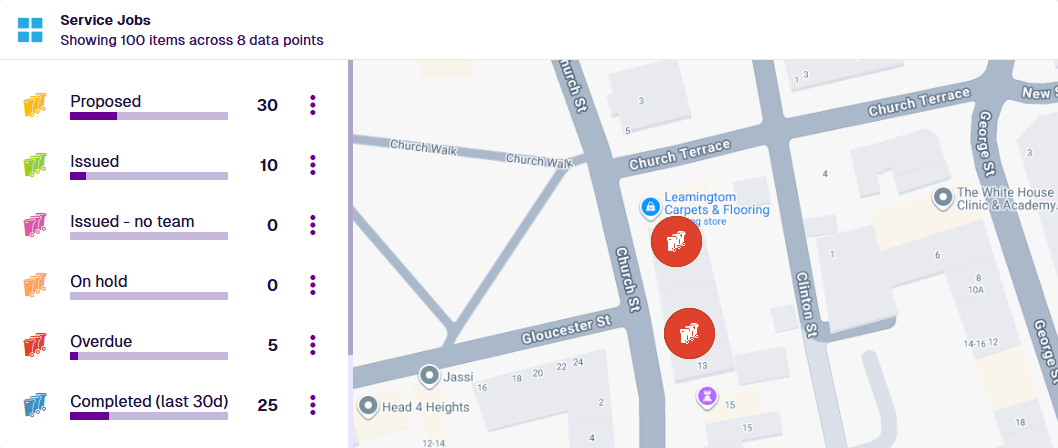
Some widgets provide a mini map that displays the locations of each data point's items. Drag the map to pan around it. To zoom in and out, scroll your mouse wheel or perform a pinch gesture.
Select an item on the map to view its details in a pop-up. To open the item in a new browser tab, select Open in the corner of the pop-up. Otherwise, select Close to return to the hub.
Data point actions
Select a data point to open its items in the default Asset App. As you hover over it, an icon will appear to indicate which app will be opened.
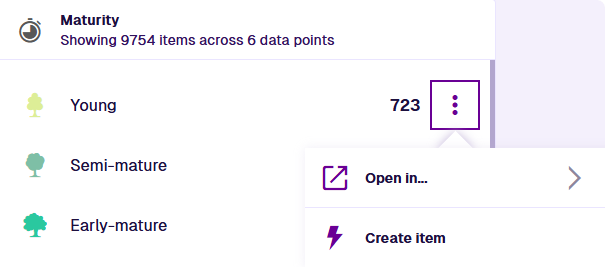
To perform an action with a data point, select its Menu button:
-
Open in - open the data point's items in a specific app.
-
Create item - use the Item Creator to create a new item of the design/interface represented by the data point's query. If it's an interface, you must choose one of the available designs that implement the interface.
Highlights
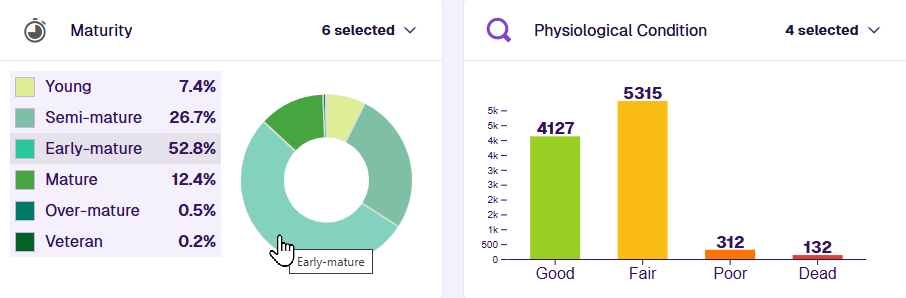
By default, highlights are displayed along the top of the hub. They provide a way to surface important numbers from widgets and render their data points as graphs.
Select a data point within a highlight to flash its position in the corresponding widget. For dense graphs where selecting individual data points is tricky, select in the top-right corner of the highlight and then choose one from the list.
Donut highlights display a scrollable legend on the left. Hover over a slice to highlight the corresponding data point in the legend and vice versa.
To hide the highlights, turn off Show highlights in the app bar. This provides more space for the widgets, so you can see more at once.
Hub actions
To perform an action with the hub, open the Hub Menu in the app bar (top-right):
-
Edit hub - change the hub's name and appearance.
-
Add to favourites - add the hub to your favourites for quick access.
- Remove from favourites - remove the hub from your favourites.
-
Clone hub - create an identical copy of the hub and open it for editing. Its name will be suffixed with (Copy).
-
Share with - share the hub with other users.
-
Delete hub - permanently remove the hub.