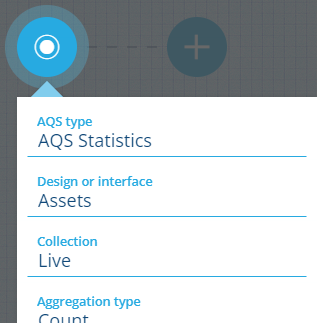
AQS Statistics node
Description
The AQS Statistics root node aggregates the values of a specific attribute on items fetched by the query and then calculates a statistic e.g. Average, Min/Max, Standard Deviation
Unlike AQS Query and AQS Join, it produces a single numerical attribute (or if grouping is applied, one attribute per group), along with the list of relevant items and attribute data.
For example, the average Column Height of queried Street Lights items = 8.39361702127
Therefore, this root node is best suited for use in these situations:
-
creating an AQS statistics data source in the Report Builder
-
managing the queries on dashboard cards
-
running queries via the Alloy API (see the Developer Docs)
Usage
All queries start with a root node. Its icon matches the design/interface being queried.
To filter the items fetched by the root node (which will be used to calculate the statistic), select to add one or more child nodes.
Configuration
Select the node to set the following properties:
-
AQS type - change to a different root node type.
-
Design or interface - items from this design/interface will be queried.
-
Collection - items from these collections will be queried. By default, only Live is selected.
-
Aggregation type - choose a statistic to calculate:
-
Count - the number of queried items.
-
Sum - all the values added together.
-
Average - the mean value (the Sum divided by the Count).
-
Maximum - the largest value.
-
Minimum - the smallest value.
-
Standard deviation population - the average variance of the values from the Average value. For queries that fetch all items of the design/interface.
-
Standard deviation sample - the average variance of the values from the Average value. For queries that only fetch some items of the design/interface.
-
Bounding box - only applies to Geometry attributes. Returns the coordinates for a rectanglar boundary that surrounds all values.
-
-
Attribute - choose the attribute that you want the statistic for (not needed for Count).
-
Group by - choose a second attribute to split the queried items into groups, according to the values they hold. A statistic will be calculated for each group, see the example below.
Example
Calculate the average column heights of street lights near and away from railways
In full detail:
Fetch items of the Street Lights design and group them by their Near railway line? attribute (two groups: true and false). Calculate the average value of the Column Height attribute for each group, and for all queried items
See JSON code
This code may reference designs, interfaces, attributes or items that don't exist in your company database.
{
  "type": "StatisticsAggregation",
  "properties": {
    "aggregationType": "Average",
    "attributeCode": "attributes_streetLightsColumnHeight_5e1db714ca31500ad87c5d18",
    "collectionCode": "Live",
    "dodiCode": "designs_streetLights",
    "groupBy": "attributes_streetLightsNearRailwayLine_602ba97b56a33800665a0895"
  }
}
See sample results
{
  "page": 1,
  "pageSize": 20,
  "results": [
    {
      "key": true,
      "value": {
        "attributeCode": "attributes_fake",
        "value": 10 // The average Column Height of Street Light items near a railway
      }
    },
    {
      "key": false,
      "value": {
        "attributeCode": "attributes_fake",
        "value": 7.76923076923 // The average Column Height of Street Light items not near a railway
      }
    },
    {
      "value": {
        "attributeCode": "attributes_fake",
        "value": 8.39361702127 // The average Column Height of all queried Street Lights items
      }
    }
  ]
}

