Dashboard
Learn about the dashboard
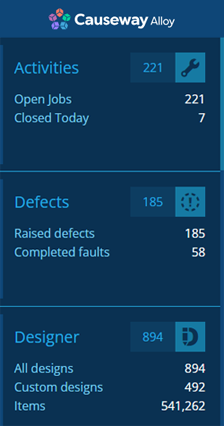
The dashboard panel appears on the left. It displays a vertical list of alphabetical cards that represent various Asset Management features.
Each card displays statistics about the feature it represents, helping you to track the performance of that feature at a glance.
Expand a card
Select a card to expand it and view its contents. To return to the dashboard, select Home.
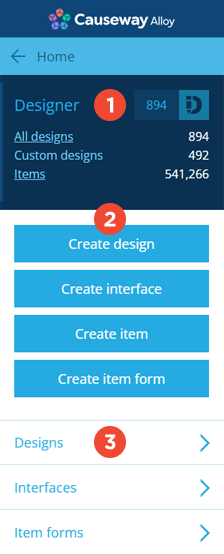
1 Queries
A card can display one or more statistical queries, which count how many items of a particular design/interface currently fulfil a set of criteria.
Selecting a query will load its items in the Data Explorer, where you can see their attribute data and perform bulk actions on them if desired.
2 Processes
The purple buttons represent processes that you can follow. Typically, these are to create whatever type of object is relevant to the card (e.g. an item, a design/interface, a workflow).
Following a process will lead you through several numbered steps within the dashboard. For example, the Create defect process within the Activities card is illustrated below.
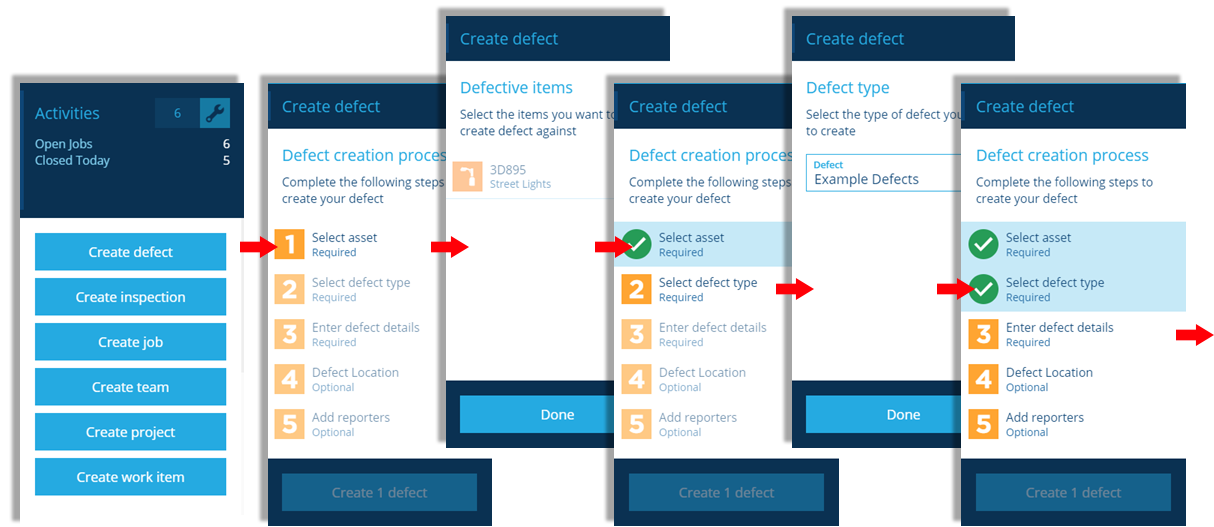
To move backwards in a process, select Back above the dashboard panel (rather than your web browser's Back button).
3 Search shortcuts
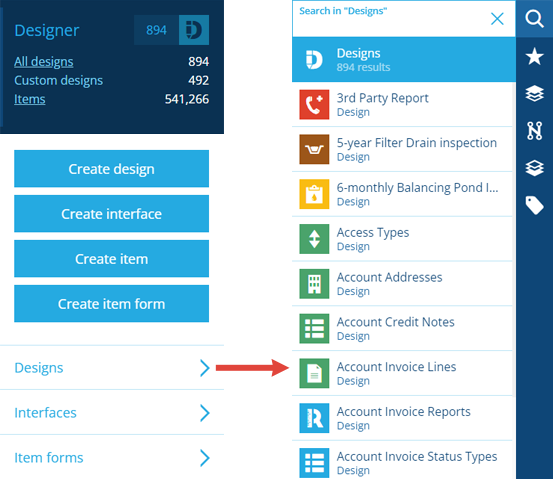
Beneath the purple buttons are the designs, interfaces and other objects related to the card. Select one of these to display a searchable list of them in the right panel.
Custom cards
To customise the appearance of existing cards and even create your own, see Dashboard Cards.