Layer style visualisation
How to change the way items are visualised
Overview
A layers style defines the items and how they are displayed within a layer on the map. You can change various display attributes to alter the way in which items are visualised on the map. Style visualisation can be configured in all types of layers using one of the following types of visualisation:
-
Basic - for Standard / Custom layer styles, item icons remain as individual items when you scale the map
-
Cluster - for Standard / Custom layer styles, item icons are clustered when you scale the map
-
Network - for network layer styles
-
WFS - for WFS layer styles
The Basic visualisation type has a limit of 500 items, this is to guard against degraded performance if a large amount of individual items are loaded and rendered. Attempting to build a Basic layer style with more than 500 items will cause an error.
Accessing the style visualisation feature
To access style visualisation use the following procedure:
-
For Standard or Custom layers (including WFS layers) select Layers in the right panel menu to open the list of all layers.
For network layers select Networks in the right panel to open the list of all networks.
-
Select a layer or network to display its list of styles.
-
Select the style that you want to edit.
-
Use the tab bar to switch tabs:
- For a standard or custom layer, select Basic visualisation or Cluster visualisations.
- For a network style use the tab bar to select the Network visualisations tab.
- For a WFS style use the tab bar to select the WFS visualisations tab.
- For Standard, Custom and Network styles the visualisation page is the same. The WFS visualisation page contains additional fields.
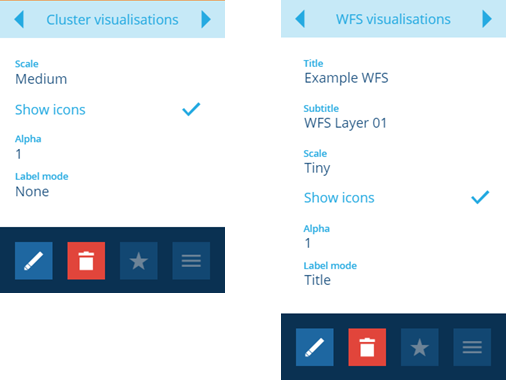
- Select Edit in the action bar to change the visualisation settings.
WFS related fields
-
Title - this allows you to enter a field title linked to data from the WFS service, for example if you link to a field in the data named
service, then the contents is displayed in the layer labels as the title. -
Subtitle - this allows you enter an additional field subtitle linked to data from the WFS service, for example if you link to a field in the data named
address, then the contents are transferred to the Subtitle field.
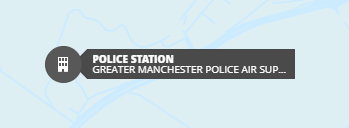
The data from the WFS service will be displayed in the labels if you activate the Label mode.
Common visualisation fields
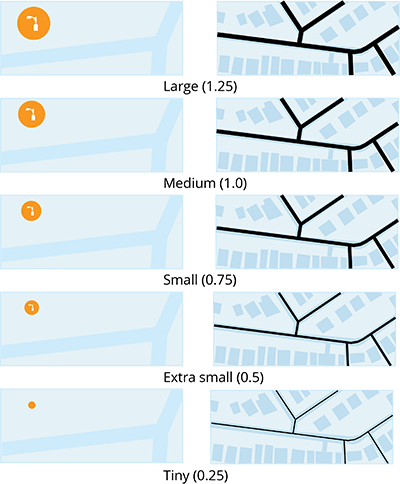
- Scale - this allows you to set the size of item icons or the line thickness for objects with geometry. There are five settings, Tiny (0.25), Extra small (0.5), Small (0.75), Medium (1.0) and Large (1.25). The default setting is Medium.
- Show icon - this allows you to show or hide the icon within an item object. The default is Show icon.
- Alpha - this allows you to set the transparency setting of the item object, you can set any value between 0 and 1, the default is 1 (100% or opaque), you cannot use 0 as a setting.

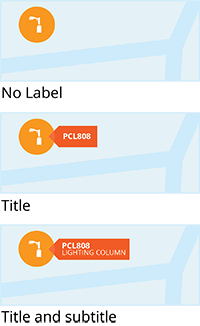
- Label mode - this allows you to attach labels to items on the map to include the title and subtitle of the item. The default is None.
- When you have completed editing the visualisation settings, select Save to apply the new settings.