Table control
Display data source values in a table
You can add any number of these to the layout of a flow document.
A Table control lets you display the output of a data source as rows and columns. It's typically used to display the attribute data of one or more items fetched by an AQS, Item or Join data source.
Table controls show dummy values while being edited.
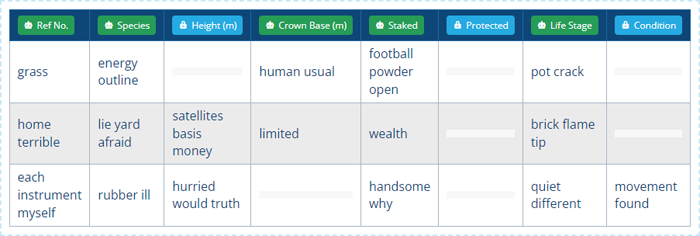
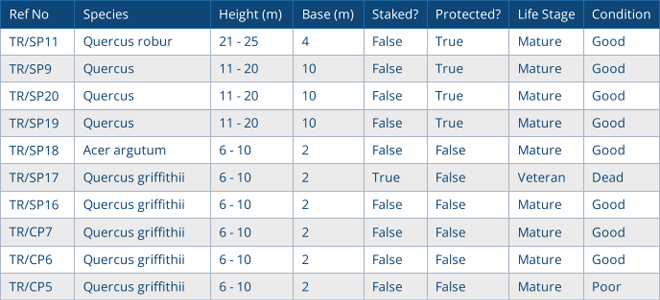
Whenever the report is run, the table will display the values from its data source in the generated report.
A similar Table control is available for tabular documents.
Add a Table control
In the Document Layout Editor, select Add at the bottom (or within a container control) and then choose Table.
Configuration
Select the control to show its properties in the toolbar.
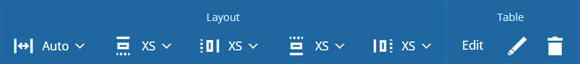
Layout properties
-
Relative width - Auto by default. The control automatically sizes itself to display its content in full (space permitting). Alternatively, you can set a constant width. See Flow control width.
-
Margins - adjust the gap between each side of the control and the content inside. See Flow control margins.
Table properties
- Edit - open the table for editing (see below).
-
Edit description - customise the control's description (shown in the toolbar).
-
Remove - delete the control.
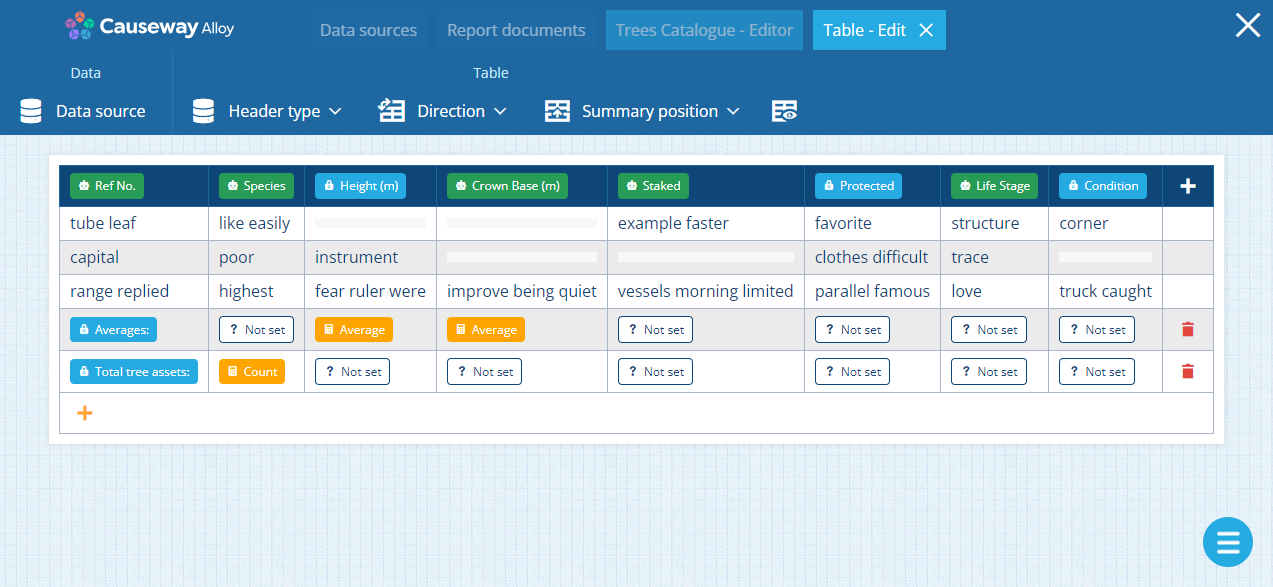
Edit the table
To edit the table's data source, headers and summary rows, select Edit in the toolbar to open the Table Editor.
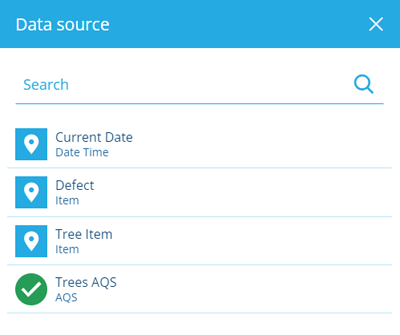
Data source
To decide what data the table will display, select Data Source in the toolbar and choose one from the list. For best results, choose an AQS, Item or Join data source.
You can change the data source at any time. However, if the table has headers that don't exist on the new data source, they will display as Unknown and should be removed!
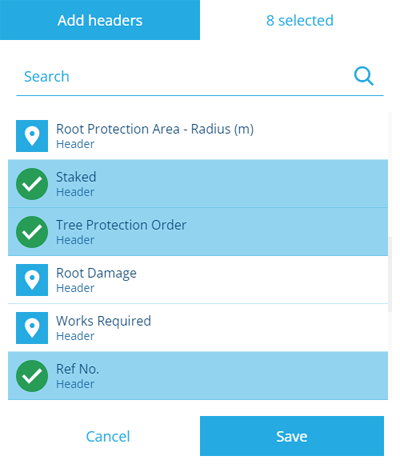
Headers
To add headers to the table, select in the table's header bar. Select any headers in the table's data source that you want to include and then select Save.
To remove a header from the table, select it and then select Remove in the toolbar.
Columns
Drag columns by their header to reorder them in the table.
To edit the properties of a column, select it, and then select a tool in the toolbar:
-
Text align - align the values of all cells in the column to the Left (default), Centre or Right.
-
Wrap / No wrap - determines how long cell values are displayed. If set to Wrap (default), they will be displayed in full across multiple lines. If set to No wrap, long values will appear as a single truncated line.
-
Header text - override the column's header with a custom label. The pill will change colour to indicate the label is now static. To revert back to a dynamic label, save this with a blank value.

-
Remove - delete the selected column.
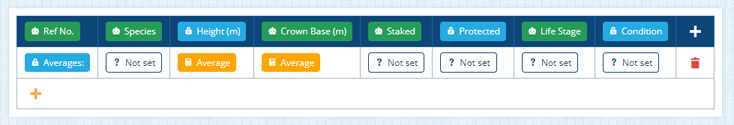
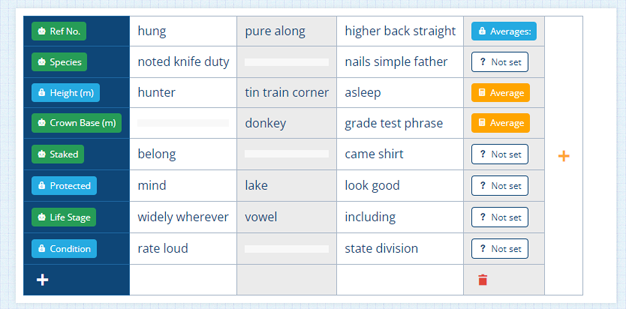
Summary rows
Use summary rows to display calculated data values before or after the table's data.
To add a summary row to the table, select in the first or last row. If the table has multiple summary rows, you can drag them around to reorder them. To delete a summary row, select in its final cell.
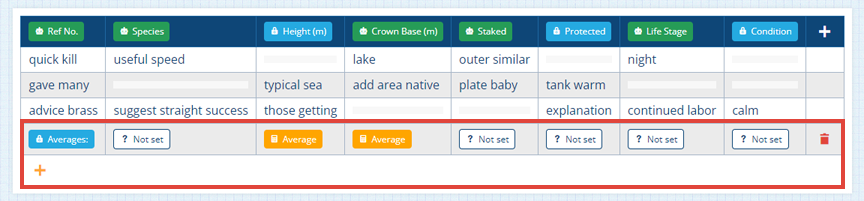
Summary cells
Any cell in a summary row can be configured to display either static text (e.g. a label that says "Total sum:") or a dynamically calculated value (e.g. the sum of a column's values).
Select a summary cell to configure it.
Static cell
To configure a summary cell to show static text:
-
In the Summary cell window, choose Static.
-
Select the Constant field and enter the text you want to display.
-
Select Save to finish.
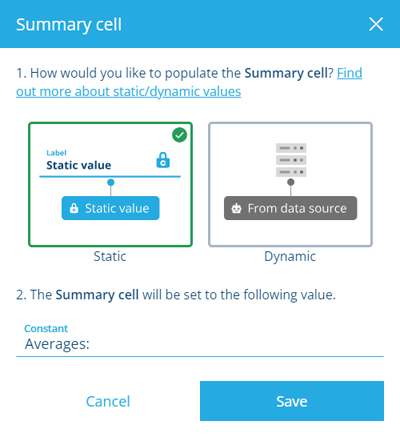
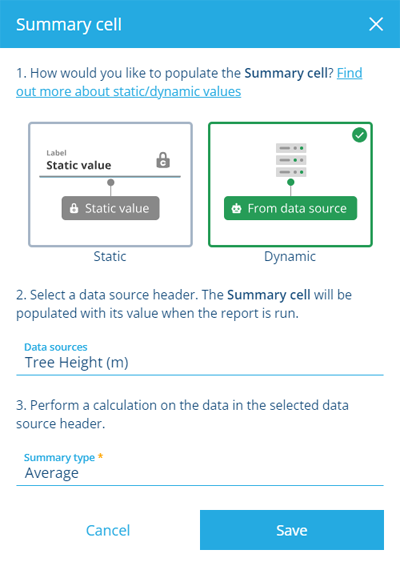
Dynamic cell
To configure a summary cell to show a dynamic calculation:
-
In the Summary cell window, choose Dynamic.
-
Select the Data sources field and choose the header you want to perform a calculation on. By default, it's the same header as the summary cell. However, you can select any other header, even one within another data source!
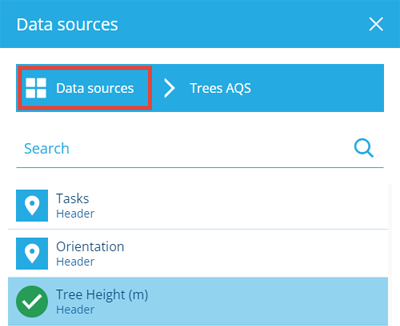
All calculations except Count require numerical input values, so choose the data source accordingly!
-
Select the Calculation field and choose one to perform:
-
Average - the mean value (the Sum divided by the Count).
-
Count - the number of items in the data source.
-
Max - the largest value.
-
Min - the smallest value.
-
Product - all the values multiplied together.
-
Standard Deviation Population - the average variance of the values from the Average value. For data sources that represent a complete set of values.
-
Standard Deviation Sample - the average variance of the values from the Average value. For data sources that represent a subset of values.
-
Sum - all the values added together.
-
-
Select Save to finish.
To clear a summary cell, leave its Constant or Data sources field blank and select Save.
Table properties
To edit the table's properties, select a tool in the toolbar:
-
Header type - determines how the table's columns will be labelled:
-
Id - columns will be labelled with header attribute codes, e.g. attributes_assetsInstalledDate
-
Name (default) - columns will be labelled with header names, e.g. Installed Date
-
-
Direction - determines what axis the table's headers appear along:
-
Horizontal (default) - the table's headers run along the top. Each row contains one item's data.
-
Vertical - the table's headers run down the left side. Each column contains one item's data.
-
-
Summary position - determines whether summary rows are positioned Before or After the table's data rows.
Horizontal direction
The appearance of summary rows before and after the data, if the table's Direction is Horizontal.
Vertical direction
The appearance of summary rows before and after the data, if the table's Direction is Vertical.
-
Show / Hide values - determines whether the dummy data rows are shown (default) or hidden for clarity.